Are Recent Mortgage Rate Increases Really Worth Worrying About?
Recent upticks in mortgage rates have current and potential homebuyers fretting. But are current mortgage rates really that unaffordable?
We looked back through the years at historical trends to put today’s current rates in context. And we think some younger Canadian homebuyers – who came of age during a record-low mortgage environment – might be surprised.
Today’s Rates
Mortgage rates have slowly crept upward over the past six months. The Bank of Canada has made three increases to its overnight rate target three times over that period; the Bank of Canada interest rate went from 0.5% to 0.75% July 12, 2017. At the following rate announcement, which came on September 6, there was another Bank of Canada interest rate hike, taking the overnight rate to 1%. Most recently, on Jan. 17, the Bank increased its target by 25 basis points to 1.25%.
Mortgage rates have correspondingly increased with each of those policy moves. Most recently, the best five-year fixed mortgage rate jumped from 2.79% on Jan. 15 to 2.94% a day later; the best five-year variable increased from 1.95% on Jan. 15 to 2.01% on Jan. 16 and then again to 2.26% on Jan. 19.
Compare today's top mortgage rates
Looking for a great mortgage rate? Check out the lowest mortgage rates available
The Bank of Canada has already hinted at future rate increases, meaning mortgage rates might be in for further hikes.
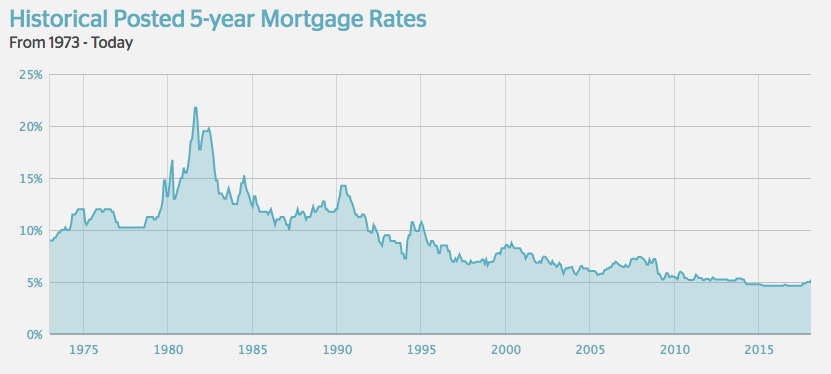
But let’s take a look back through the years to see how today’s rate environment compares to years past. First, we’ll look at how the posted five-year fixed mortgage rate (which currently sits at 5.14%) has fluctuated over the past few decades.
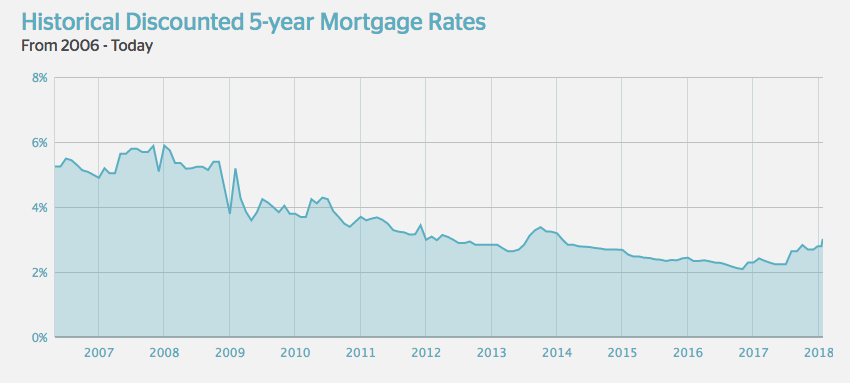
Then we’ll compare today’s best discounted rate of 2.94% to discounted rates of yesteryear.
Ratehub.ca offers handy graphs that provide a historical view of posted mortgage rates dating back to 1973.
The 1970s: The Beginning
The 70s were defined by regular interest rate increases. The posted rate for five-year fixed rates was 9% on Jan.1, 1973. It increased steadily throughout the year before settling at 10.25% on Dec. 1, 1973.
The rate would drop once in the 1970s, to 10%, before continuing its upward trajectory. On May 1, 1974, the rate was 11.5%; on Jan. 1, 1975 it jumped to 12%.
Following some slight fluctuations, the posted five-year fixed rate would settle at 13.25% on Dec. 1, 1979. These rates sure do put our current 5.14% posted rate in context, don’t they?
And we’re just getting started.
The 1980s: The Country’s Highest Rates in Recent History
In a decade that saw the first personal computers launched, the final years of the Cold War, and – most importantly for this article at least – a major global economic recession that clearly impacted mortgage rates.
The decade started where the 70s had left off; the posted five-year fixed mortgage rate sat at 13.25% on Jan. 1, 1980. However, it wouldn’t hold that position for long.
On April 1, the rate jumped to 16.75%. It fell to 13% on May 1 of that year before setting off on the largest climb in recent history.
It jumped to 16% on Dec. 1, 1980. A year later, it would climb from 17% to 18.5%, 20%, and finally 21.75% on Aug. 1, 1981 – the highest mark on record.
Thankfully, for homebuyers at the time, rates trended downward for the rest of the decade. Still, rates remained historically high until the mid-1990s.
By Jan. 1, 1985 rates were down to 12.25%. At the beginning of 1987, rates fell to 10.5% but were back up to 12% by the end of the decade.
The 1990s: Settling to More Affordable Levels
Grunge and hip-hop proliferated and the World Wide Web spread, well, worldwide. While young people were smelling teen spirit, homebuyers would have an easier time affording a home – at least in terms of mortgage rates – than previous generations.
Though the year started off where the 80s left off – with the posted five-year fixed rate at 12% — rates would drop to 8.5% by July 1, 1996 and 6.6% in Dec. 1998, before jumping back up to 8.25% at the end of the decade.
The New Millennium
While reports of a worldwide digital crash proved to be vastly exaggerated following the turn of the Millennium, interest rates did, indeed, continue their own downward trend.
By the end of 2000, rates had fallen to 7.95%. They fell by more than 1% at the end of 2001 to 6.85%. By mid-2003 rates reached a record-low of 5.8% and fell even further to 5.7% in March 2004.
Mid-2000s and Beyond: A Look at Discounted Rates
Up until now, we have looked at historical posted five-year fixed rates. However, in recent years, historical discounted five-year mortgage rates have become more readily available – which provide a better glimpse into what rates were offered by lenders (they are often several basis points lower than posted rates).
For context, it’s important to remember today’s current best five-year fixed rate is 2.94%.
In May 2006, lenders were offering discounted rates of 5.25% on five-year fixed rates. They jumped to 5.88% in November 2007 but would trend downward, for the most part, over the course of the next decade.
Past lows include 3.79% in January 2009 (following the great recession); 3.59% in May 2009; 3.39% in November 2010.
In January 2012, mortgage rates hit what was, at the time, an unbelievable low: A sub-3% five-year fixed mortgage rate when lenders started offering 2.99%.
As we know, though, rates continued to fall: Dropping to 2.64% in April 2013, 2.54% in February 2015, 2.35% in September 2015, and 2.09% in November 2016.
Rates then set off on an upward climb, once again. They jumped to 2.42% in February of last year, 2.64% in August, 2.83% in October, and, most recently, to 2.94% in January 2018.
But is 2.94% anything to fret about? Not according to a historical analysis of mortgage rates. It’s important to remember we’re still in a record-low environment and that five-year fixed rates are still very affordable.
Also read: