Housing Affordability Across Canada
Affordability in Canada is a hot-button issue in several housing markets across the country. Property prices increase and affordability decreases as the population flocks to major urban centres. For instance, the Greater Toronto Area’s population is projected to grow by more than 100,000 people annually over the next three years, according to a Toronto Board of Trade report.
As the population of many Canadian cities continue to grow, that may lead many prospective homebuyers to ask “how much mortgage can I afford?”
To measure affordability, we looked at homeownership as a percentage of monthly pre-tax income using the RBC Housing Affordability Measure. For example, a reading of 40% means that homeownership costs—which includes mortgage payments, utilities, and property taxes—takes up 40% of a typical household’s monthly pre-tax income.
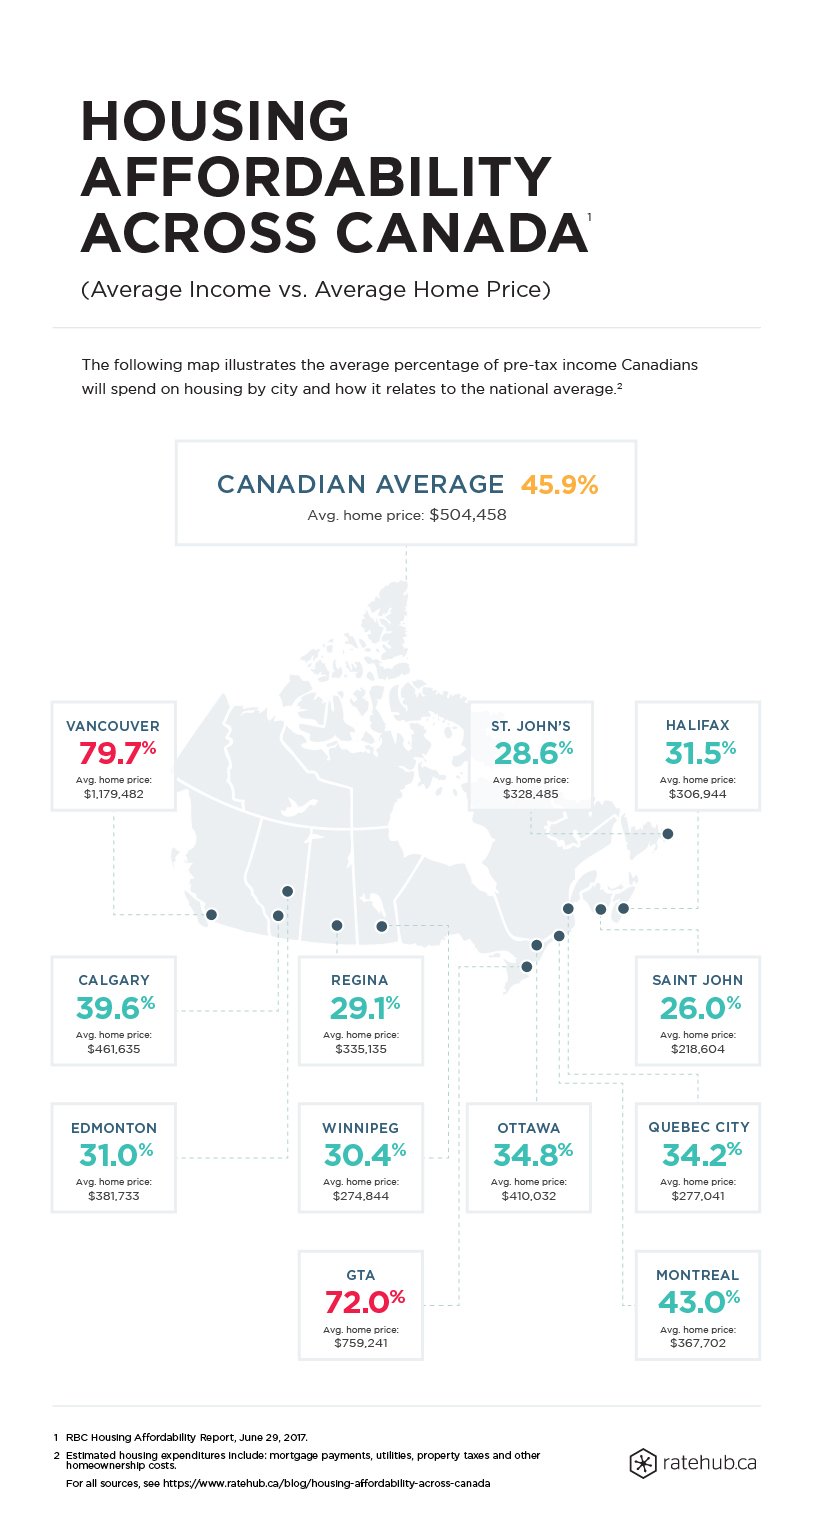
According to the Canada Mortgage and Housing Corporation’s benchmark, housing is considered “affordable” when no more than 30% of pre-tax income is spent on homeownership expenses. In Canada, the national average is 45.9%. This means many Canadians will spend almost half of what they earn paying off their mortgage and other property-associated expenses.
Vancouver and the GTA
Unsurprisingly, the Vancouver area tops the charts with a score of 79.7% in the first quarter of 2017. What’s surprising is this rate has actually decreased since the third quarter of 2016, when it measured an alarming 92%. One year after British Columbia implemented a 15% tax on foreign buyers in Metro Vancouver, affordability seems to have improved slightly. The Greater Toronto Area (GTA) comes in second place at 72%, up 8.3 percentage points compared to the third quarter of 2016. Ontario introduced a 16-point housing affordability plan in April, but only time will tell if it will have a positive impact.
When looking at these two cities, it’s clear how unaffordable they truly are. Only those with significantly higher-than-average household incomes can afford to purchase an average-priced home in these two areas.
Montreal, Calgary, and Ottawa round out the top five most unaffordable list at 43%, 39.6%, and 34.8%, respectively. Although these numbers are lower than Toronto and Vancouver, they’re still above the 30% affordability threshold.
More affordable options
On the opposite end of the affordability spectrum, Atlantic Canada has some of the most affordable cities in the country. Saint John, N.B., is the most affordable city with costs at only 26% of pre-tax monthly income—four percentage points below the affordability benchmark. Similarly, St. John’s, N.L., comes in at 28.6%. While affordability in these cities has decreased slightly, they remain relatively stable compared to Toronto and Vancouver.
When looking to buy a new home, understanding affordability across the country and how it’s changing in different markets is critical to determine whether or not you can afford to purchase a home. A mortgage affordability calculator can help you determine how much you can afford while a mortgage payment calculator will help estimate your monthly costs.