How Much You Need to Earn to Buy a House in the Greater Toronto Area
For home buyers early on in their hunt, at a time of record-high home prices and rock-bottom interest rates, pinpointing exactly what they can afford and where isn’t exactly clear cut.
To give those kickstarting their home search a leg up, we at TheRedPin looked at prices across the Greater Toronto Area and analyzed what your salary needs to be in order buy a house in each of the region’s most prominent cities.
From Toronto at the centre, to Newmarket up north, Oshawa in the east, and Burlington far to the southwest, the range of home prices varies quite a bit and, naturally, so do the salaries required to afford them. It is important to note however, we looked at the combined household income rather than just an individual’s salary.
Before we jump head-first into looking at the GTA on a city-by-city basis, the table below is a general overview of the salaries needed across the region to buy property, broken down by housing type:
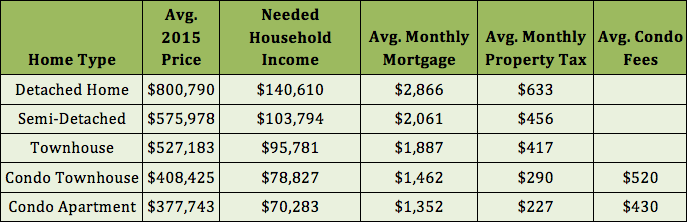
In regards to the numbers, we utilized mortgage calculators, factoring in an interest rate of 2.49% (given the cuts in the key lending rate), property taxes, and average utility costs running at $250 a month. Condo fees were calculated based on your average 900- and 750-square-foot condo, townhouse, and apartment respectively. Home prices were effective as of July 2015.
The interactive map shown below looks at the needed salary on city-by-city basis with average prices for all home types.
View What you need to earn to buy a home in the Greater Toronto Area [Map] in a full screen map.
The prices highlighted in this analysis cover all home types—detached, semis, towns, and condos combined. With that information in mind, and the fact the figures are more reflective of single family homes, we considered a down payment of 20% was made, which is more in-line with repeat buyers who have built up equity.
Below is a complete list of what you need to afford an average home in each of Greater Toronto Area’s largest 16 housing markets:
Burlington
Average Home Price: $588,667
Needed Household Income: $103,660
Avg. Monthly Mortgage: $2,107
Avg. Monthly Property Tax: $407
Property Tax Rate: 0.83%
Milton
Average Home Price: $542,415
Needed Household Income: $94,376
Avg. Monthly Mortgage: $1,941
Avg. Monthly Property Tax: $325
Property Tax Rate: 0.72%
Oakville
Average Home Price: $828,181
Needed Household Income: $142,562
Avg. Monthly Mortgage: $2,964
Avg. Monthly Property Tax: $587
Property Tax Rate: 0.85%

Brampton
Average Home Price: $487,884
Needed Household Income: $91,631
Avg. Monthly Mortgage: $1,746
Avg. Monthly Property Tax: $451
Property Tax Rate: 1.11%
Mississauga
Average Home Price: $552,114
Needed Household Income: $98,866
Avg. Monthly Mortgage: $1,976
Avg. Monthly Property Tax: $409
Property Tax Rate: 0.89%
Toronto
Average Home Price: $618,202
Needed Household Income: $105,975
Avg. Monthly Mortgage: $2,213
Avg. Monthly Property Tax: $363
Property Tax Rate: 0.71%
Aurora
Average Home Price: $738,630
Needed Household Income: $130,466
Avg. Monthly Mortgage: $2,644
Avg. Monthly Property Tax: $585
Property Tax Rate: 0.95%
Markham
Average Home Price: $800,318
Needed Household Income: $136,835
Avg. Monthly Mortgage: $2,864
Avg. Monthly Property Tax: $534
Property Tax Rate: 0.80%
Newmarket
Average Home Price: $606,683
Needed Household Income: $109,791
Avg. Monthly Mortgage: $2,171
Avg. Monthly Property Tax: $501
Property Tax Rate: 0.99%
Richmond Hill
Average Home Price: $877,114
Needed Household Income: $149,881
Avg. Monthly Mortgage: $3,139
Avg. Monthly Property Tax: $607
Property Tax Rate: 0.83%
Vaughan
Average Home Price: $792,775
Needed Household Income: $135,635
Avg. Monthly Mortgage: $2,837
Avg. Monthly Property Tax: $548
Property Tax Rate: 0.83%
Whitchurch–Stouffville
Average Home Price: $773,665
Needed Household Income: $134,269
Avg. Monthly Mortgage: $2,769
Avg. Monthly Property Tax: $561
Property Tax Rate: 0.87%
Ajax
Average Home Price: $489,137
Needed Household Income: $94,912
Avg. Monthly Mortgage: $1,750
Avg. Monthly Property Tax: $522
Property Tax Rate: 1.28%
Pickering
Average Home Price: $526,872
Needed Household Income: $98,702
Avg. Monthly Mortgage: $1,886
Avg. Monthly Property Tax: $496
Property Tax Rate: 1.13%
Whitby
Average Home Price: $485,744
Needed Household Income: $94,381
Avg. Monthly Mortgage: $1,738
Avg. Monthly Property Tax: $526
Property Tax Rate: 1.30%
Oshawa
Average Home Price: $347,737
Needed Household Income: $73,117
Avg. Monthly Mortgage: $1,244
Avg. Monthly Property Tax: $455
Property Tax Rate: 1.57
- Stats based on 2015 January to July figures from the Toronto Real Estate Board
- Interest rate: 2.49%
- Amortization: 25 years
- Monthly utility costs average: $250
- Down payment: 20%
- Condo fees estimated for 900 and 750 square foot condo town and apartment respectively
- Property tax calculated on a per-city basis
TheRedPin is a full-service real estate brokerage that carries the largest database of residential listings in the Greater Toronto Area. Sign up to our newsletter simply by clicking here.
Flickr: Paul Bica